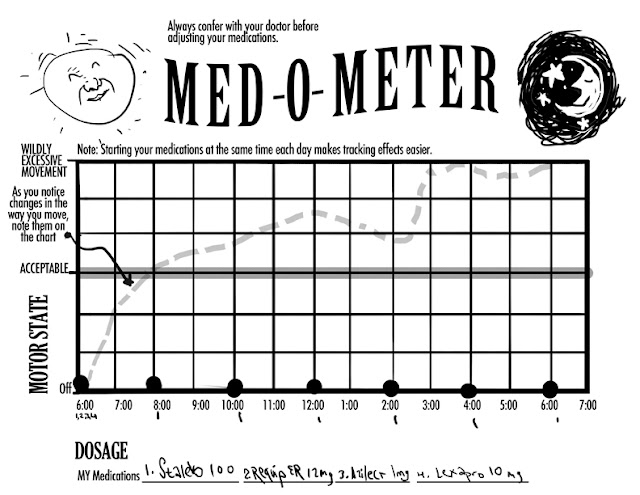
Most of us (but by no means all) adapt well to levedopa or other medications in the earlier stages after diagnosis. Then as time passes we find that we must fine-tune our timing to avoid motor fluctuations (off and on periods, dyskinesia, etc.) Graphing our dosages and timing is a good way to keep track. So I have drawn up a chart to make things easier. You're welcome. There is a pdf of the blank chart here for your downloading pleasure. When you download and print the chart, it should look like this
Here is how to use it. Starting with the bottom line fill in and number all your medications, not just your PD meds. Your chart will look something close to the one below...
If you need more space to add medications, I suggest putting them in above the existing blanks I have provided. Note that I have added the strength of each medication as well as the medication's name to make it easier for your doctor to interpret results when you confer with them (See CYA notice above.) Once you have the medication blanks filled in, you are ready to get graphing! But you'll be best off if you start with your morning cycle, so if it's not time for the first dose of the day, you should start tomorrow. I have found that to keep my meds straight it works best for to start my medication cycle at the same time each day. This eliminates one variable, and the fewer the variables, the easier it is to see what is happening. A pill timer is a big help, or set up a schedule of dosage alarms on your smart phone's clock app. Let's say your cycle starts every day at 7:00 am. Your first entry will look something like the chart below...
List your meds by number as you take them throughout the day. As the day goes by, also track your motor state ranging up and down from "off", (difficulty in moving and lots of tremor) through acceptable, (Approximating normal life) up to excessive motion with uncontrolled dyskinesia. Whenever you notice your state changing, note it down with a fever line on the graph. (The wavy line shown here in gray) By the end of the day, it will look something like this...
In the In the above example the person takes medications 1,2,3, and 4 first thing in the morning,and then every two hours, takes medication one.
Below is another example of how the chart may look
So what is going on? That's for you and your doctor to figure out (see CYA notice at the top of this post.) But just for grins, let's look at these last two charts above again. In the next-to-last chart we find the patient spends much of the day with too much unwanted motion suggesting the levedopa (Stalevo, in this case) dosage could be spaced out in time more, In the last chart, we see rather frequent periods whered the patient seems undermedicated, suggesting a boost in dosage frequency or strength
A final thought or two. First, Don't rely on just one day of data. Lots of things can interfere with getting good results, tiredness, what you ate and when, exercise, and my favorite, getting so caught up in graphing that you forget to take your stupid pill. Try for a couple of weeks. Some clear patterns should emerge.
Second, the medications and their effects are not perfect, Even with the wonderful ability of the brain to gauge and compensate for error and imperfections in our tools and protocols for handling the problems that arise the state of the art is not equal to the job of restoring perfection. We can only approximate normal for a percentage of the day. This depends on variables like disease progression and severity, If you are faithful about keeping track of your doses and responses, this should be a helpful tool for you and your doctor in fine-tuning your medication regime to get the best results possible, in this best of all possible worlds. (See CYA notice at the top of the post)


No comments:
Post a Comment